您的浏览器禁用了JavaScript(一种计算机语言,用以实现您与网页的交互),请解除该禁用,或者联系我们。 [世界黄金协会]:黄金ETF流量:2025年8月 - 发现报告

黄金ETF流量:2025年8月

报告封面

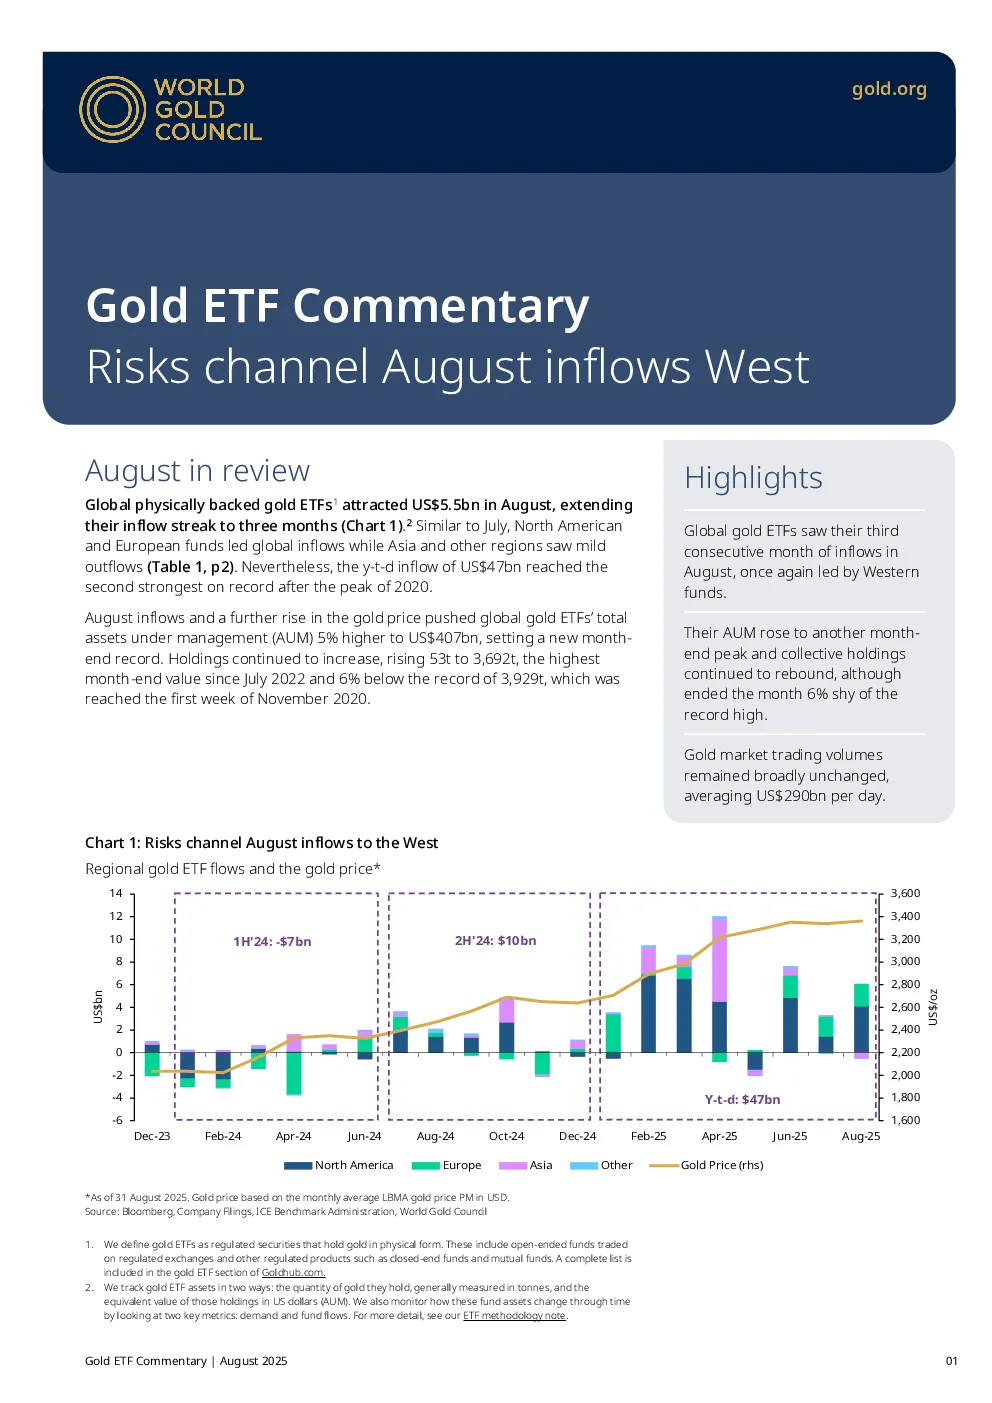
August in review Highlights Global physically backed gold ETFs1attracted US$5.5bn in August, extendingtheir inflow streak to three months(Chart1).2Similar to July, North Americanand European funds led global inflows while Asia and other regions saw mildoutflows(Table1, p2).Nevertheless, the y-t-d inflow of US$47bn reached thesecond strongest on record after the peak of 2020. Global gold ETFs saw their thirdconsecutive month of inflows inAugust, once again led by Westernfunds. August inflows and a further rise in the gold price pushed global gold ETFs’ totalassets under management (AUM) 5% higher to US$407bn, setting a new month-end record. Holdings continued to increase, rising 53t to 3,692t, the highestmonth-end value since July 2022 and 6% below the record of 3,929t, which wasreached the first week of November 2020. Their AUM rose to another month-end peak and collective holdingscontinued to rebound, althoughended the month 6% shy of therecord high. Gold market trading volumesremained broadly unchanged,averaging US$290bn per day. The UK also witnessed strong inflows in the month, likelybuoyed by stagflation concerns – the country’s inflationrebounded while the US tariffs and a tax hike on employers –which could also push up prices further – cloud growth. Regional overview North American funds added US$4.1bn in August, theregion’s third consecutive monthly inflow. Asian flows flipped negative in August, losing US$495mn.China lost the most: continued equity strength, with theCSI300 Stock Index jumping 10% in August, kept divertinglocal investors away from gold. In contrast, India saw itsfourth consecutive monthly inflow in August, supported byelevated safe-haven needs amid weak equities as well asongoing global trade and geopolitical risks. But they wereinsufficient to offset Chinese outflows.Flows in otherregions remained mildly negative, shedding US$50mn.Australian inflows were insufficient to offset South Africanoutflows in the month. Continued strength in demand can be linked to: •Persistent trade risk and broader market uncertainty•The consensus short dollar trade, which reduces theopportunity cost of holding gold•Lower rate expectations as the market digested Powell’sJackson Hole comments as dovish. The latter was arguably the most important catalyst intomonth-end. Outflows that had been seen in the days leadingup to Jackson Hole reversed swiftly, as investors anticipated aSeptember rate cut. Chart2:North Americanlow-cost fundsseerecordy-t-dinflows It is also notable that low-cost gold backed ETFs, oftenviewed as a proxy for long-term strategic positioning, arehaving their best year on record (Chart2). We consider thisto be a signal that – beyond short-term market noise –investors are steadily building safe-haven allocations inresponse to a backdrop of elevated risks. Annual net cumulative flowsof North American low-costfunds* European funds have now experienced inflows fourmonths in a row, adding US$1.9bn in August.The UK,Switzerland, and Germany led the charge. During the month,the US imposed a surprise 39% tariff on Switzerland, thehighest on any developed nation.3This sudden andunexpected hit has affected the country’s economicprospects, pushed up safe-haven needs among localinvestors and increased demand for gold. German inflows may have also been supported by highersafe-haven demand as the country’s Q2 GDP growth wasrevised down further, sparking investor fears of recession.4Meanwhile, with the euro and Swiss franc strengtheningagainst the dollar, holdings in FX-hedged products also rose. Total net longsin COMEX gold futures fell 3.4% duringthe month, concluding August at 652t,6while moneymanager net longs rose 3.7% to 461t. Money managers’bullish bets rose steeply in early August around the news ofUS tariffs on Swiss bullion, leading to a surge in the COMEXgold price. Consecutive price rises towards the end of themonth also saw gold futures traders build up their longs. Volumes remain stable Gold market trading volumesremained broadlyunchanged, averaging US$290bn per day–just 2% lowerm/m.5The minor decline was led by a 17% m/m drop inexchange-traded volumes – trading at both COMEX andShanghai Futures Exchange cooled. Despite this, the averagevolume of US$114bn/day has remained above its 2024 levelof US$102bn/day. Gold ETF trading volumes were also downacross all regions, decreasing 9% m/m to US$4.5bn/day. ButOTC trading activities rose, reaching US$171bn/day onaverage in the month, 12% higher than July and well abovethe 2024 average of US$128bn/day. World Gold Council Research We are a membership organisation that champions the rolegold plays as a strategic asset, shaping the future of aresponsible and accessible gold supply chain. Our team ofexperts builds understanding of the use case andpossibilities of gold through trusted research, analysis,commentary and insights. Jeremy DePessemier, CFAAsset Allocation Strategist Johan PalmbergSenior Quantitative Analyst Kavita