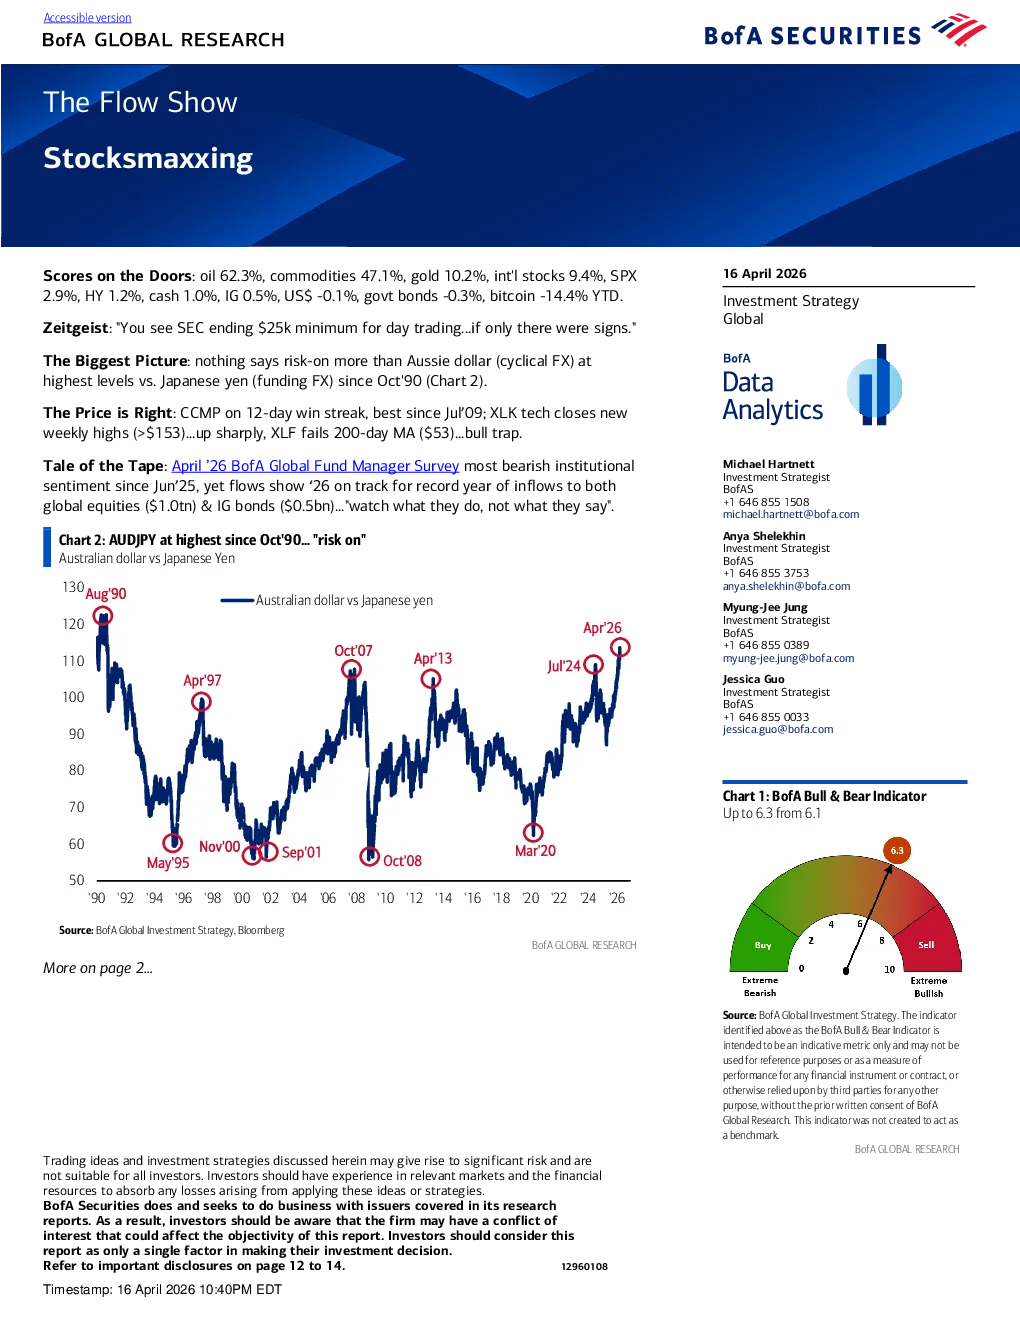
Stocksmaxxing Scores on the Doors: oil 62.3%, commodities 47.1%, gold 10.2%, int'l stocks 9.4%, SPX2.9%, HY 1.2%, cash 1.0%, IG 0.5%, US$ -0.1%, govt bonds -0.3%, bitcoin -14.4% YTD. 16 April 2026 Investment StrategyGlobal Zeitgeist: "You see SEC ending $25k minimum for day trading...if only there were signs." The BiggestPicture: nothing says risk-on more than Aussie dollar (cyclical FX) athighest levels vs. Japanese yen (funding FX) since Oct'90 (Chart 2). The Price is Right: CCMP on 12-day win streak, best since Jul’09; XLK tech closes newweekly highs (>$153)...up sharply, XLF fails 200-day MA ($53)...bull trap. Tale of the Tape:April ’26 BofA Global Fund Manager Surveymost bearish institutionalsentiment since Jun’25, yet flows show‘26 on track for record year of inflows to bothglobal equities ($1.0tn) & IG bonds ($0.5bn)..."watch what they do, not what they say". Michael HartnettInvestment StrategistBofAS+1 646 855 1508michael.hartnett@bofa.com Anya ShelekhinInvestment StrategistBofAS+1 646 855 3753anya.shelekhin@bofa.com Myung-Jee JungInvestment StrategistBofAS+1 646 855 0389myung-jee.jung@bofa.com Jessica GuoInvestment StrategistBofAS+1 646 855 0033jessica.guo@bofa.com More on page 2… Source:BofA Global Investment Strategy. The indicatoridentified above as the BofA Bull & Bear Indicator isintended to be an indicative metric only and may not beused for reference purposes or as a measure ofperformance for any financial instrument or contract, orotherwise relied upon by third parties for any otherpurpose, without the prior written consent of BofAGlobal Research. This indicator was not created to act asa benchmark.BofA GLOBAL RESEARCH Timestamp: 16 April 2026 10:40PM EDT Weekly Flows: $11.3bn into stocks, $7.9bn into bonds, $1.2bn into gold, $1.2bn intocrypto, $172.2bn from cash. Flows to Know: •Cash: $172.2bn outflow…largest outflow ever (risk-on but also tax-related...averageApril cash outflow was $41bn past 4 years vs. $103bn this year - Chart 11),•HY debt: $3.1bn inflow…largest since May’25,•Treasuries: $3.0bn outflow…1stoutflow in 11 weeks,•EM stocks: $10.5bn outflow…largest outflow in 11 weeks,•Europe stocks: $4.7bn outflow…largest since Nov’24 (Chart 12),•Stocks: $11.3bn inflow, driven by $17.4bn inflow to US equities,•Japan: $4.4bn outflow…largest since Nov’25 (Chart 13),•China: $10.8bn outflow…largest in 11 weeks,•Korea: $2.5bn outflow…largest ever,•Tech: $3.8bn outflow…largest since May’25 (Chart 14). BofA Private Clients: $4.3tn AUM…64.2% stocks, 18.0% bonds, 10.5% cash; biggestinflow to T-bills since Jan’26; bid for stocks continues…equity ETF share count up 3%YTD, 1% past 4 weeks, 0.2% in past week; private clients buying high dividend, industrialsector, TIPS ETFs, selling consumer staples, bank loan, energy ETFs in past 4 weeks. BofA Bull & Bear Indicator: up to 6.3 from 6.1; inflows to HY & EM debt, tighter HY &AT1 credit spreads, more bullish S&P 500, gold, 2-year UST futures positioning, offsettech sector outflows & bearish Apr Global FMS (cash 4.3%, investors less OW stocks vs.bonds); "old" BofA Bull & Bear Indicator down to 5.3 from 5.4.1 Macro bears vs stock bulls: macro bears say "can't buy risk until inflation peaks”...Q2risk is oil up, CPI up, yields up & bond tantrum (a la '13, '15, '22, '23–Table 2) on comboof surprise reacceleration of labor market, geopolitically weak US$, pressure for Warshto start dovish (in the 3 months after the start of 7 new Fed chair terms, yields rose by50bps on average - Table 1); stock bulls say "so long as yields & unemployment in 4-5%range we gucci"...SPX EPS on course for >$330 justifies new highs (Chart 3), stocksmuch better than bonds as policymakers placate electorates with strong nominal GDPgrowth, Gen QE & Gen Z know stock market“too big to fail”. We say: both CPI & EPS expectations peak in Q2...2-year Treasury yield won’t break 4%,2s30s UST yield curve bull steepens to >140bps, US$ DXY index hits new lows (<96),China Shanghai index makes run to 4.5k, consumer discretionary beats energy in Q2. •Buy Curve steepeners: hard to pass through higher oil prices when consumerfrustrated re affordability (Trump approval inflation new low <33%) & insecure re AIjob replacement; macro says cuts not hikes (US small biz capex intentions slump toDec’09 lows–Chart 4), US rate expectations (max dovish 125bps cuts in Oct, maxhawkish 20bps hikes in March, now 5bps cuts–Chart 5) to fall further. •Sell US Dollar: tariffs, threats end NATO, OPEC petrodollar recycling...US dollarbuyers strike as low appetite for more US assets (foreigners own $20tn US stocks, $10tn US Treasuries, $5tn US corporate bonds) to fund $39tn of US debt and its$1.2tn annual debt servicing cost; Fed pressure to cut to grow, US policymakers willtrade weaker dollar rather than higher bond yields to attract foreign capital. •Buy Commodities: commodities>stocks>bonds>US$ secular asset return peckingorder...commodities…risk hedge for allocators, inflation hedge for allocator