您的浏览器禁用了JavaScript(一种计算机语言,用以实现您与网页的交互),请解除该禁用,或者联系我们。 [BofA GLOBAL RESEARCH]:太阳能储能:3月出口同比激增90%,或受政策和地缘政治影响 - 发现报告

太阳能储能:3月出口同比激增90%,或受政策和地缘政治影响

报告封面

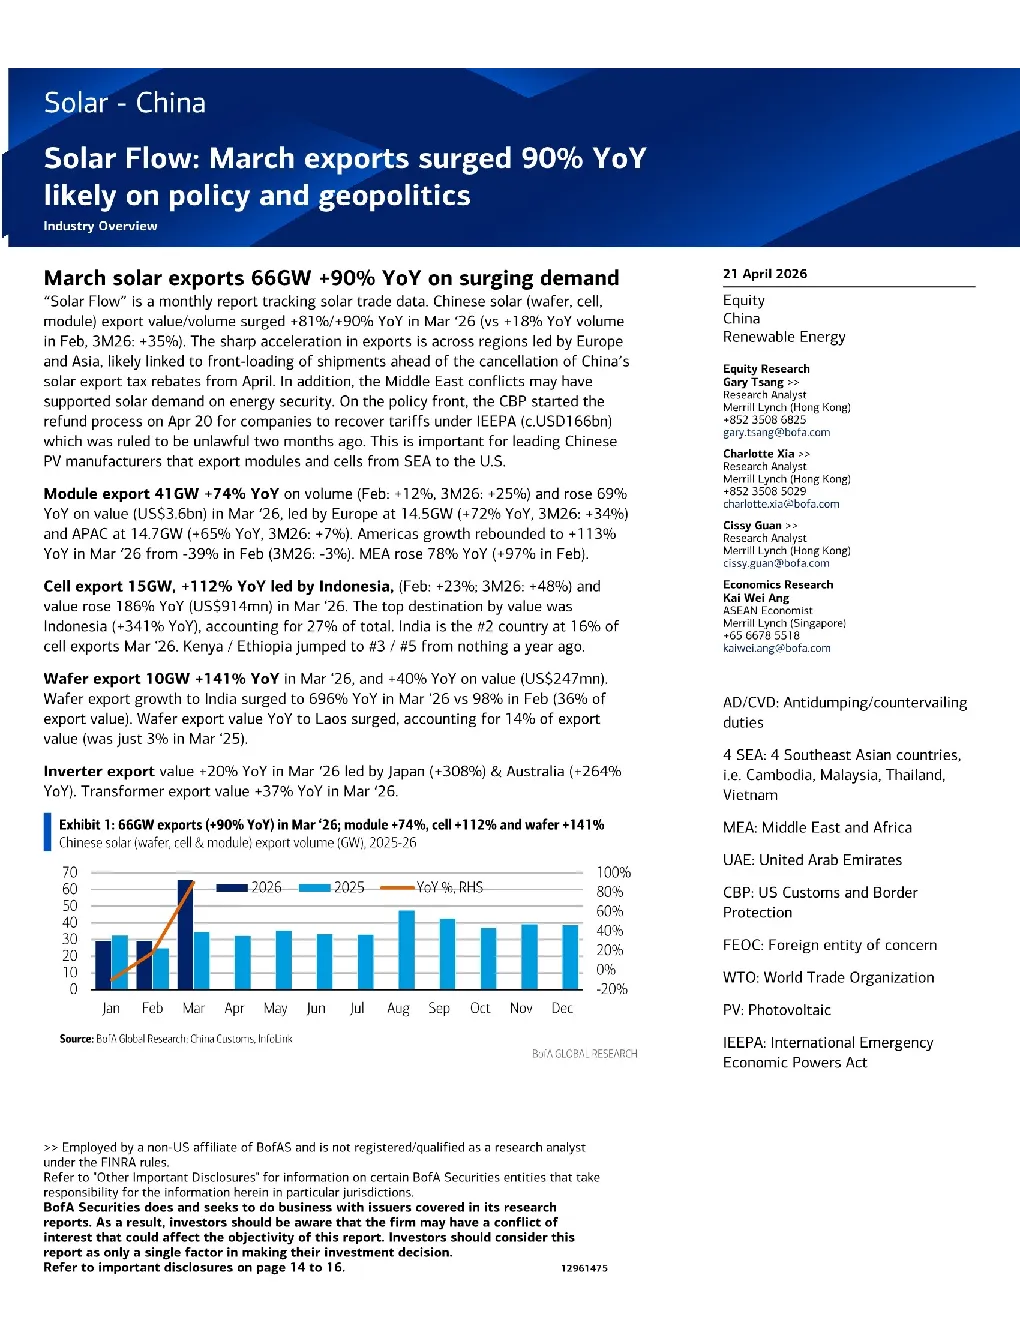
likely on policy and geopoliticsIndustryOverview March solar exports 66GW +90% YoY on surging demand ChinaRenewable Energy module)export value/volume surged +81%/+90% YoY in Mar‘26 (vs +18%YoYvolumein Feb, 3M26: +35%).The sharp acceleration in exports is across regions led by Europe and Asia, likely linked to front-loading of shipments ahead of the cancellation of China'ssolar export tax rebates from April. In addition, the Middle East conflicts may havesupported solar demand on energy security. On the policy front, the CBP started therefund process on Apr20 for companies to recover tariffs under IEEPA (c.USD166bn)which was ruled to be unlawful two months ago. This is important for leading ChinesePV manufacturers that export modules and cells from SEA to the U.SModule export 41GW +74% YoY on volume (Feb: +12%,3M26: +25%) and rose 69%YoY on value (US$3.6bn) in Mar‘26, led by Europe at 14.5GW (+72% YoY,3M26: +34%) Equity ResearchGary Tsang >Research Analyst Merill Lynch (Hong Kong)+85235086825gary.tsang@bofa.comCharlotte Xia >>Research AnalystMerrill Lynch (Hong Kong) +852 3508 5029charlotte.xia@bofa.comCissy Guan >Research AnalystMerrill Lynch (Hong Kong) and APAC at 14.7GW (+65% YoY, 3M26: +7%). Americas growth rebounded to +113%YoY in Mar '26 from -39% in Feb (3M26: -3%). MEA rose 78% YoY (+97% in Feb)Cell export 15GW, +112% YoY led by Indonesia, (Feb: +23%;3M26: +48%)and cissy-guan@bofa.comEconomics ResearchKai Wei AngASEAN Economist Indonesia (+341% YoY), accounting for 27% of total. India is the #2 country at 16% ofcell exports Mar‘26.Kenya / Ethiopia jumped to #3 / #5 from nothing a year ago.Waferexport10GW+141%YoYinMar‘26,and+40%YoYonvalue (USs247mn) Merrill Lynch (Singapore)+65 6678 5518kaiwei.ang@bofa.com Wafer export growth to India surged to 696% YoY in Mar 26 vs 98% in Feb (36% ofexport value). Wafer export value YoY to Laos surged, accounting for 14% of exportvalue (was just 3% in Mar ‘25) duties4SEA:4SoutheastAsian countries, i.e. Cambodia, Malaysia, Thailand,VietnamMEA: Middle East and Africa YoY).Transformer export value +37% YoY in Mar‘26.Exhibit 1: 66GW exports (+90% YoY) in Mar 26; module +74%, cell+112% and wafer +141% Chinese solar (wafer, cell & module) export volume (GW), 2025-2670100%A UAE: United Arab Emirates CBP: US Customs and Border ProtectionFEOC: Foreign entity of concern IEEPA: International EmergencyEconomic Powers Act >> Employed by a non-US affiliate of BofAS and is not registered/qualified as a research analystunder the FINRA rulesRefer to'Other Important Disclosures' for information on certain BofA Securities entities that take responsibility for the information herein in particular jurisdictions.BofA Securities does and seeks to do business with issuers covered in its research Module Exhibit 2: Mar module export volume (41GW) rose 74% YoY 50150% Exhibit 4: Top5China's exporting countries accounted for30% ofmodule exports in Mar‘26China March solar module export value by country YoY % changeJan-25Feb-25Mar-25Apr-25 Africa surged by +72%/+65%/+113%/+78% in MarChinese solar module export volume (GW) by region YoY % change Chinese solar module exports by value by region, 3M26 BofA GLOBAL RESEARCH China module exports by province YoY growth % 360% Exhibit 12:US module shipment prices remained stable at USD27c/Win Mar'26Solar module shipment prices (USD/W) to the US, Europe, and China Exhibit 16: India -4% YoY, Indonesia, Philippines, and Laos surged inMarchChina solar cell export value (USS mn) by destination China March cell export value by country Exhibit 19:Top 5China's exporting countries accounted for 80% in Mar*26China March solar wafer exports by countries by values YoYChina polysilicon export value (USS mn) and YoY change 60 Exhibit 24: Top 3 countries took the leading position with 90% share inMar°26China's major polysilicon exporting countries historical share (USs mn) Exhibit 23: Top 2 accounted for 83% of Chinese polysilicon exports inMar‘26China March polysilicon exports by countries by values of Chinese Mar exportsChina inverter exports by origin province YoY change 400% China March inverter exports by country 37% YoYChina transformer export value (USS mn) and YoY change 1,200 76% YoYinJan‘26Malaysia monthly solar module exports (USS mn) YoY in Feb ‘26Thailand monthly solar module exports (USS mn) 400 400 YoY in Feb‘26Vietnam monthly solar module exports (USS mn) Us Exhibit 35: Feb'26 US solar import volumefell by 18% YoY 8 BofA GLOBAL RESEARCH BofA GLOBAL RESEARCH BofA GLOBAL RESEARCH 90 100 Feb'26 on Malaysia recoveryMonthly US solar module import volume by destinations (4 Southeast Asian 26vs35% inJan‘26Monthly US solar cell import volume by destinations (4 Southeast Asian countries and others) countries and others) BofA GLOBAL RESEARCH Exhibit 45: Japan solar module imports value (US$57mn) fell -4% YoYin Feb'26Japan solar module imports (USS mn) and YoY change Exhibit 46: China accounted for 78