您的浏览器禁用了JavaScript(一种计算机语言,用以实现您与网页的交互),请解除该禁用,或者联系我们。 [世界黄金协会]:黄金ETF流量:2026年3月 - 发现报告

黄金ETF流量:2026年3月

报告封面

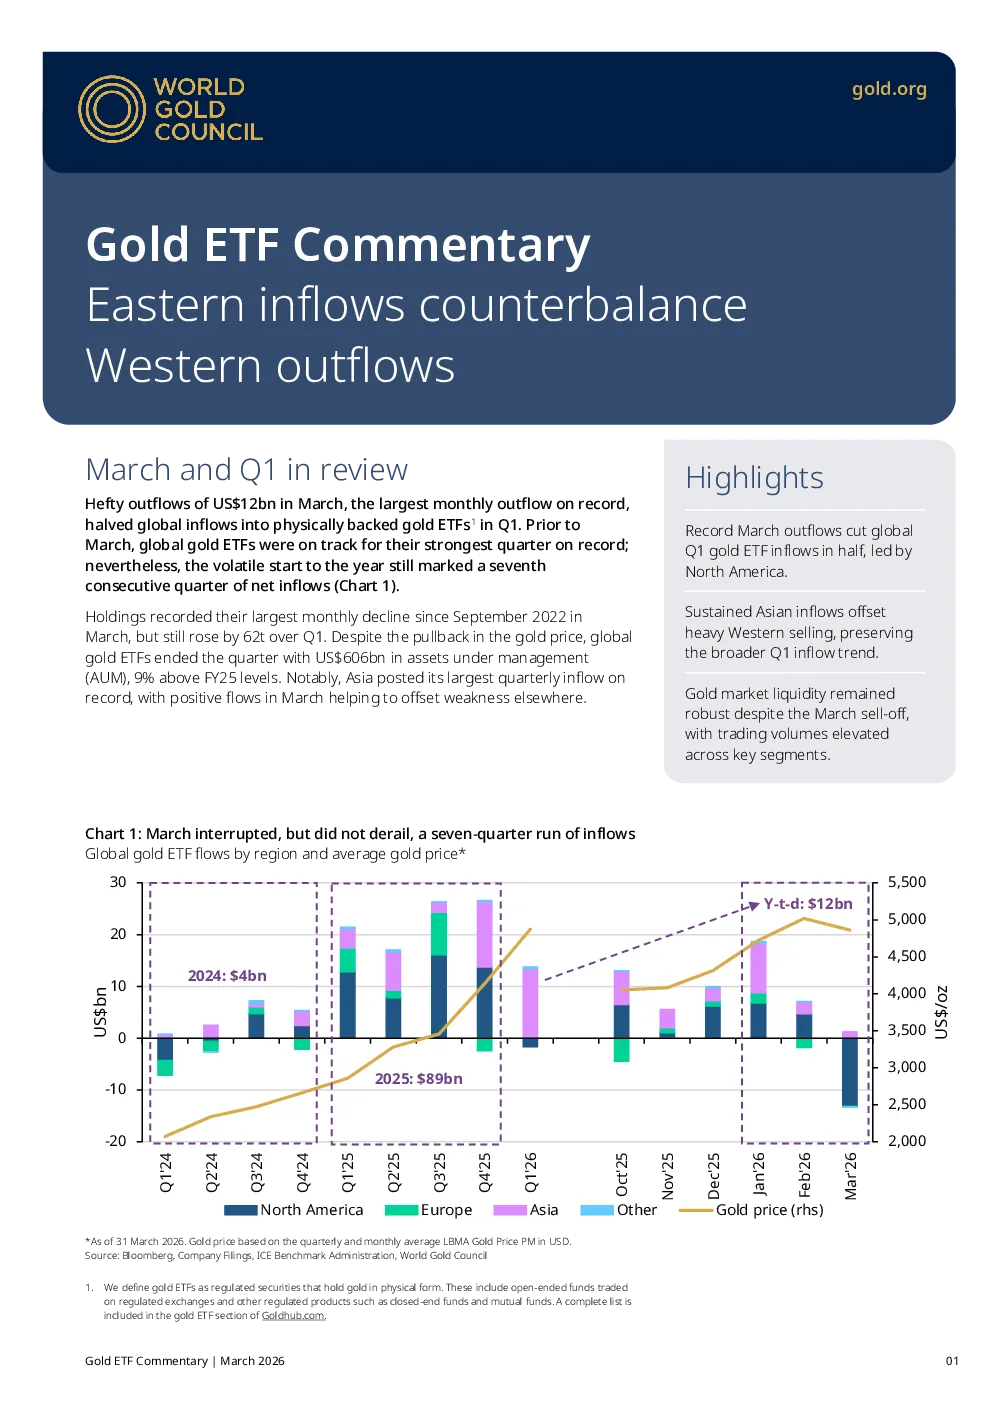
March and Q1 in review Highlights Hefty outflows of US$12bn in March, the largest monthly outflow on record,halved global inflows into physically backed gold ETFs1in Q1. Prior toMarch, global gold ETFs were on track for their strongest quarter on record; Record March outflows cut globalQ1 gold ETF inflows in half, led byNorth America. Sustained Asian inflows offsetheavy Western selling, preservingthe broader Q1 inflow trend. Holdings recorded their largest monthly decline since September 2022 inMarch, but still rose by 62t over Q1. Despite the pullback in the gold price, globalgold ETFs ended the quarter with US$606bn in assets under management(AUM), 9% above FY25 levels. Notably, Asia posted its largest quarterly inflow on Gold market liquidity remainedrobust despite the March sell‑off,with trading volumes elevated Even so, flows recovered quickly, with the region addingUS$8bn over the subsequent 12 months. A similar patternfollowed the GFC, when the end of the inflow streak wasfollowed by US$16bn of net inflows over the next year, Regional overview North America recorded sizeable outflows of US$13bn inMarch, ending a nine-month streak of inflows.Sellingpressure persisted throughout the month and marked thelargest monthly outflow on record, leaving North America as European funds saw US$154mn of outflows in March,reducing the region’s Q1 inflows to US$27mn.Germany,Italy and France led monthly selling. Flows closely trackedgold price movements: sizable outflows dominated thesecond half of March as prices fell, while modest inflows Several drivers that previously supported inflows reversedcourse in March and became key contributors to regional At the same time, inflation concerns linked to geopoliticaltensions in the Middle East led the European Central Bank tohold rates steady in March while signalling a willingness tohike should inflation accelerate.5Rising inflationarypressures and a more hawkish policy stance pushed regional •Broader risk‑off conditions, triggered by Operation EpicFury2, weighed on most asset classes – except oil – andlikely prompted US investors to raise liquidity by selling •Commodity Trading Advisors (CTAs)entered mid-Marchwith elevated long positioning and appear to have •Opportunity costs roseas the US dollar and interestrates moved higher, while rate expectations shiftedmaterially from potential cuts in 2026 to rates now Asian gold ETFs added US$2bn in March, marking aseventh consecutive month of inflows and lifting Q1inflows to US$14bn, the strongest quarter on record. China led monthly additions, driven by heightenedsafe‑haven demand amid geopolitical risks, falling localequity markets, and a weaker currency. China also accounted Asnoted last month, North America has experienced onlytwo other periods with at least nine consecutive months ofinflows – during the Global Financial Crisis (GFC) and theCOVID‑19 pandemic.In both cases, the streaks werefollowed by sharp reversals. Notably, the fourth-, fifth- and Elsewhere, dip‑buying activity supportedinflows across theregion. Indian investors continued to increase gold ETFallocations as well6, adding US$177mn in March and Funds in other regions recorded modest outflows ofUS$27mn – trimming Q1 inflows to US$285mn –largelydriven by Australia. Despite heightened gold price volatility, 5.Monetary policy decisions| European Central Bank | 19 March 2026.6.India launched an additional fund in March, bringing the total number of Indian goldETFs to 26. For a full list of gold ETFs that we track, please visit:Gold ETF: Stock, In tonnage terms, trading activity painted a similar picture.OTC volumes rose 17% to 1,749t, while trading in exchangesincreased 14% to 1,530t per day. Global gold ETF tradingvolumes recorded a 13% m/m decline, but overall market Gold market activity rose Global gold market trading volumes7rebounded inMarch, averaging US$525bn, 11% higher m/m.Despite thesharp price pullback during the month, liquidity remainedample across all market segments. Over‑the‑counter (OTC)trading activity rose 13% to US$272bn per day, well abovethe 2025 average of US$180bn. Exchange volumes also Positioning data showed a modest reduction intotal COMEXnet longs, which fell 1% over the month to 500t.8Intra-month managed money positions declined sharply,shedding 40t during the third week of March, coinciding withthe steep price correction.At the same time, non‑reportable World Gold Council Research We are a membership organisation that champions the rolegold plays as a strategic asset, shaping the future of aresponsible and accessible gold supply chain. Our team of Jeremy De Pessemier, CFAAsset Allocation Strategist Johan PalmbergSenior Quantitative Analyst Kavita ChackoResearch Head, India Krishan GopaulSenior Analyst, EMEA We drive industry progress, shaping policy and setting thestandards for a perpetual and sustainable gold market. Louise StreetSenior Markets Analyst Lead Author Marissa SalimSenior Research Lead