您的浏览器禁用了JavaScript(一种计算机语言,用以实现您与网页的交互),请解除该禁用,或者联系我们。 [美国银行证券]:7月全球基金经理调查:投资者情绪自2月以来最乐观 - 发现报告

7月全球基金经理调查:投资者情绪自2月以来最乐观

2025-07-15 美国银行证券 carry~强
报告封面

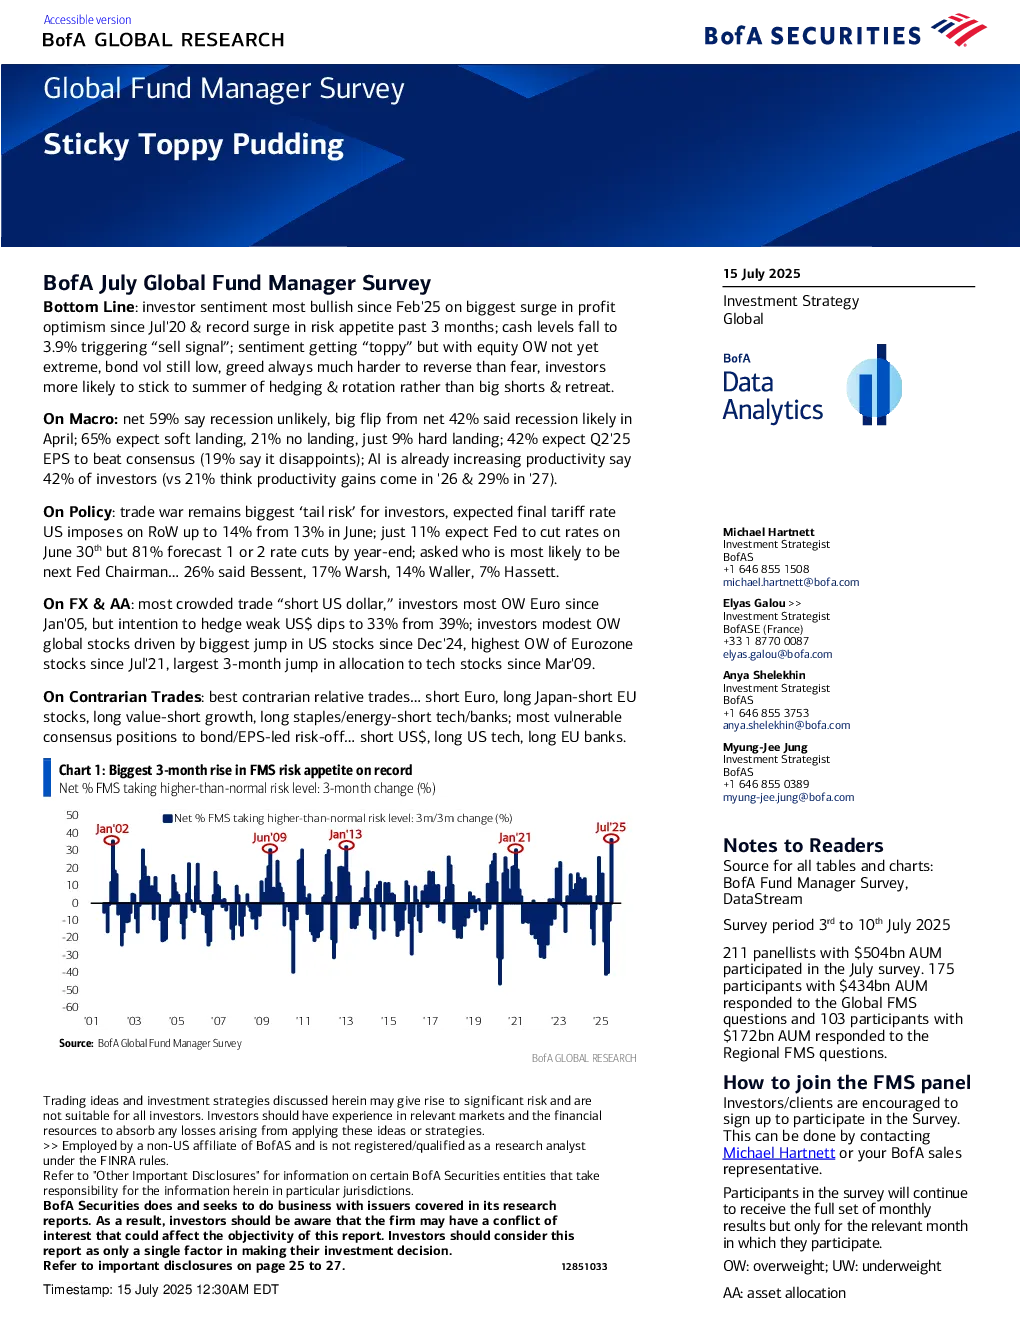
Sticky Toppy Pudding 15 July 2025 BofAJuly Global Fund Manager SurveyBottom Line: investor sentiment most bullish since Feb'25 on biggest surge in profit Investment StrategyGlobal optimism since Jul'20 & record surge in risk appetite past 3 months; cash levels fall to3.9% triggering“sell signal”; sentiment getting“toppy”but with equity OW not yetextreme, bond vol still low, greed always much harder to reverse than fear, investorsmore likely to stick to summer of hedging & rotation rather than big shorts & retreat. On Macro:net 59% say recession unlikely, big flip from net 42% said recession likely inApril; 65% expect soft landing, 21% no landing, just 9% hard landing; 42% expect Q2'25EPS to beat consensus (19% say it disappoints); AI is already increasing productivity say42% of investors (vs 21% think productivity gains come in '26 & 29% in '27). On Policy: trade war remains biggest‘tail risk’for investors, expected final tariff rateUS imposes on RoW up to 14% from 13% in June; just 11% expect Fed to cut rates onJune 30thbut 81% forecast 1 or 2 rate cuts by year-end; asked who is most likely to benext Fed Chairman…26% said Bessent, 17% Warsh, 14% Waller, 7% Hassett. Michael HartnettInvestment StrategistBofAS+1 646 855 1508michael.hartnett@bofa.com On FX& AA: most crowded trade“short US dollar,”investors most OW Euro sinceJan'05, but intention to hedge weak US$ dips to 33% from 39%; investors modest OWglobal stocks driven by biggest jump in US stocks since Dec'24, highest OW of Eurozonestocks since Jul'21, largest 3-month jump in allocation to tech stocks since Mar'09. Elyas Galou>>Investment StrategistBofASE (France)+33 1 8770 0087elyas.galou@bofa.com Anya ShelekhinInvestment StrategistBofAS+1 646 855 3753anya.shelekhin@bofa.com On Contrarian Trades: best contrarian relative trades…short Euro, long Japan-short EUstocks, long value-short growth, long staples/energy-short tech/banks; most vulnerableconsensus positions to bond/EPS-led risk-off…short US$, long US tech, long EU banks. Myung-Jee JungInvestment StrategistBofAS+1 646 855 0389myung-jee.jung@bofa.com Net % FMS taking higher-than-normal risk level: 3-month change (%) Notes to ReadersSource for all tables and charts: BofA Fund Manager Survey,DataStream Survey period 3rdto 10thJuly 2025 211 panellists with $504bn AUMparticipated in the July survey. 175participants with $434bn AUMresponded to the Global FMSquestions and 103 participants with$172bn AUM responded to theRegional FMS questions. How to join the FMS panelInvestors/clients are encouraged to Tradingideas and investment strategies discussed herein may give rise to significant risk and arenot suitable for all investors. Investors should have experience in relevant markets and the financialresources to absorb any losses arising from applying these ideas or strategies.>> Employed by a non-US affiliate of BofAS and is not registered/qualified as a research analyst sign up to participate in the Survey.This can be done by contactingMichael Hartnettor your BofA salesrepresentative. under the FINRA rules.Refer to "Other Important Disclosures" for information on certain BofA Securities entities that take responsibility for the information herein in particular jurisdictions.BofA Securities does and seeks to do business with issuers covered in its research Participants in the survey will continueto receive the full set of monthlyresults but only for the relevant monthin which they participate. reports. As a result, investors should be aware that the firm may have a conflict ofinterest that could affect theobjectivity of this report. Investors should consider thisreport as only a single factor in making their investment decision.Refer to important disclosures on page 25 to 27.12851033 OW: overweight; UW: underweight Timestamp: 15 July 2025 12:30AM EDT AA: asset allocation Charts of the Month Our broadest measure of FMS sentiment,based on cash levels, equity allocation, globalgrowth expectations improved to 4.3 from 3.3,the highest level since Feb'25. Percentile rank of FMS growth expectations, cash level, and equity allocation BofA FMS average cash level declined to 3.9%in July from 4.2% in June, triggering a“sell”signal; median 4-week S&P 500 loss post 17“sell”signals since 2011 is -2% (biggest lossrecorded post-sell signal = -29%, best gain3%). 2nd“sell”signal in past week from BofA GlobalInvestment Strategy trading rules; BofA GlobalFlow Trading Rule triggeredlast week (see TheFlow Show report); BofA Global Breadth Ruleremains close to a“sell”signal; July FMS datatakes BofA Bull & Bear Indicator to 6.2 from6.1 (sell signal requires >8.0). Investor sentiment most bullish since Feb'25……cash levels now below 4%, 86% expect softor no landing, and 59% say recession unlikely… …but global growth expectations, allocation toglobal/US equities not at extreme bull levels. Expectations for the global economy recoveredfurther in July, with net 31% of FMSparticipants expecting weaker