您的浏览器禁用了JavaScript(一种计算机语言,用以实现您与网页的交互),请解除该禁用,或者联系我们。 [汇丰]:Kimi、momo与潜在警示信号:风险资产疲软主要集中于半导体与亚洲,momo踩踏不会引发广泛抛售 - 发现报告

Kimi、momo与潜在警示信号:风险资产疲软主要集中于半导体与亚洲,momo踩踏不会引发广泛抛售

2026-07-20 汇丰 我不是奥特曼
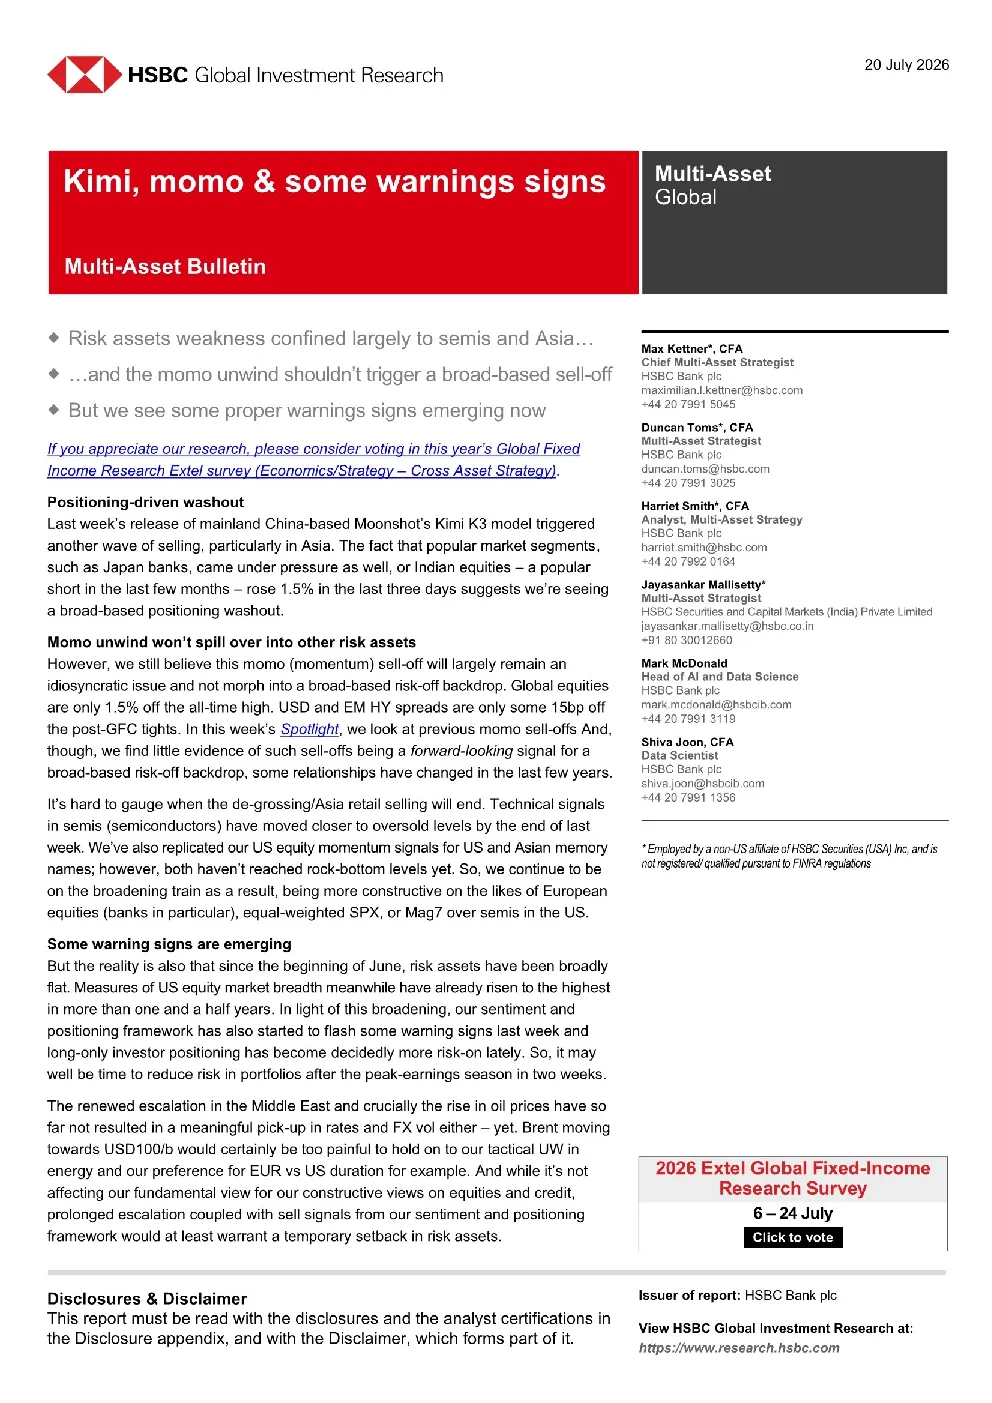
报告封面

Kimi, momo & some warnings signs +Risk assets weakness confined largely to semis and Asia..+ ...and the momo unwind shouldn't trigger a broad-based sell-off• But we see some proper warnings signs emerging now Chief Multi-Asset StrategistHSBC Bankplcmaximilian.l.kettner@hsbc.com+442079915045Duncan Toms*,CFA Multi-AssetStrategistHSBC Bank plcduncan.toms@hsbc.com+442079913025Harriet Smith*, CFA IncomeResearchExtelsurvey (Economics/Strategy-CrossAsset Strategy). Last week's release ofmainland China-based Moonshot's Kimi K3 model triggered Analyst, Multi-Asset StrategyHSBC Bank plcharriet.smith@hsbc.com+442079920164Jayasankar Mallisetty* another wave of selling,particularly in Asia.The fact that popular market segments,suchas Japan banks, came under pressure as well, or Indian equities-a popularshort in the last few months -rose 1.5% in the last three days suggests we're seeingabroad-basedpositioningwashout. Multi-AssetStrategistHSBC Securities and Capital Markets (India) Private Limitedjayasankar.mallisetty@hsbc.co.in+918030012660Mark McDonald Momounwindwon'tspill over into otherriskassetsHowever,westillbelievethismomo(momentum)sell-offwill largelyremainan idiosyncratic issueand not morph into a broad-based risk-off backdrop.Global equitiesare only 1.5% off the all-time high. USD and EM HY spreads are only some 15bp offthe post-GFC tights. In this week's Spotlight, we look at previous momo sell-offs And,though, we find little evidence of such sell-offs being a forward-looking signal for abroad-based risk-off backdrop, some relationships havechanged in the lastfew years. Head of Al and Data ScienceHSBC Bank plcmark.mcdonald@hsbcib.com+44 20 7991 3119Shiva Joon,CFA Data ScientistHSBC Bank plcshiva.joon@hsbcib.cor+442079911356 It's hard to gauge when the de-grossing/Asia retail selling will end. Technical signalsin semis (semiconductors)have moved closerto oversold levels bythe endof lastweek.We've also replicated our US equity momentum signals for US and Asian memorynames:however.bothhaven'treachedrock-bottomlevelsvet.So.wecontinuetobeonthebroadeningtrainasaresult,beingmoreconstructiveonthe likesofEuropeanequities (banks in particular),equal-weighted SPX, or Mag7over semis in the US * Employed by a non-US affliate of HSBC Securities (USA) Inc, and isnot registered/qualifed pursuant to FINRA regulations Some warning signs are emerging But the reality is also that since the beginning of June, risk assets have been broadlyflat. Measures of US equity market breadth meanwhile have already risen to the highestin more than one and a half years. In light of this broadening, our sentiment andpositioningframework has also started toflash some warning signs last week andlong-onlyinvestorpositioninghasbecomedecidedlymorerisk-onlately.So,itmaywell be timeto reduce risk in portfolios afterthe peak-earnings season in two weeks. The renewed escalation in the Middle East and crucially the rise in oil prices have sofar not resulted in a meaningful pick-up in rates and FX vol either - yet. Brent movingtowards USD100/b would certainly be too painful tohold on toour tactical UW inenergy and our preference for EUR vs US duration for example. And while it's notaffectingourfundamentalviewforourconstructiveviews onequitiesand credit,prolonged escalation coupled with sell signals from our sentiment and positioningframework would at least warrant a temporary setback in risk assets. Issuer of report: HSBC Bank plc Disclosures&Disclaimer Thisreportmust beread withthedisclosures and theanalyst certifications inthe Disclosure appendix, and with the Disclaimer, which forms part of it. ViewHSBCGlobal Investment Researchat:https://www.research.hsbc.com ThemomounwindsincetheendofJune-drivenbythesell-offinseminames-hasreached historic levels now (Chart 1). Other asset classes, such as FX or rates, have been largelyunaffected so far though (Chart 2). Historically, this makes sense. The below tables consider the biggest corrections in Usmomentum names,and howtheseaffectotherassetclasses.We lookattwodifferenttimeperiods: 1)from 2012-2022 and 2) since 2023. Clearly, before 2023 the biggest days of unwinding in US momentum didn't result in a broad-based risk-off backdrop (Chart 3).Hit ratios (i.e.,percentage of days with negative performance)areconsistentlybelow5o%,forexample.Creditspreadstightenonaverage.There'sbeennobearish read-across for EM FX and high-beta FX, EM rates and even for US equities overall. Thishaschangedsince2023though.ThebiggestUSmomentumcorrectionshavealsoledtoabroad-based risk-off backdrop, whether in equities, credit or in FX and EMD (Chart 4). So,we'dargueafurtherunwindingofmomostocks inthe coming weeks doesposeaseriousthreattothebroaderrisk-assetspectrum-especiallysinceEMandhigh-betaFX,credit and rates have been so relaxed about it so far. weconsidertheone-weekforwardperformanceofvariousassetclassesfollowingthemostseveremomocorrections.Again, we find that before 2023, there's little evidence of that (C