PDD Q1:棍棒或许能打断我的骨头……但言语永远伤不了我?PDD的Q1业绩会动摇公司忠实信徒的信心吗? PDD Q1:棍棒或许能打断我的骨头……但言语永远无法伤害我?PDD Q1的业绩是否会动摇公司忠实信徒的信心?
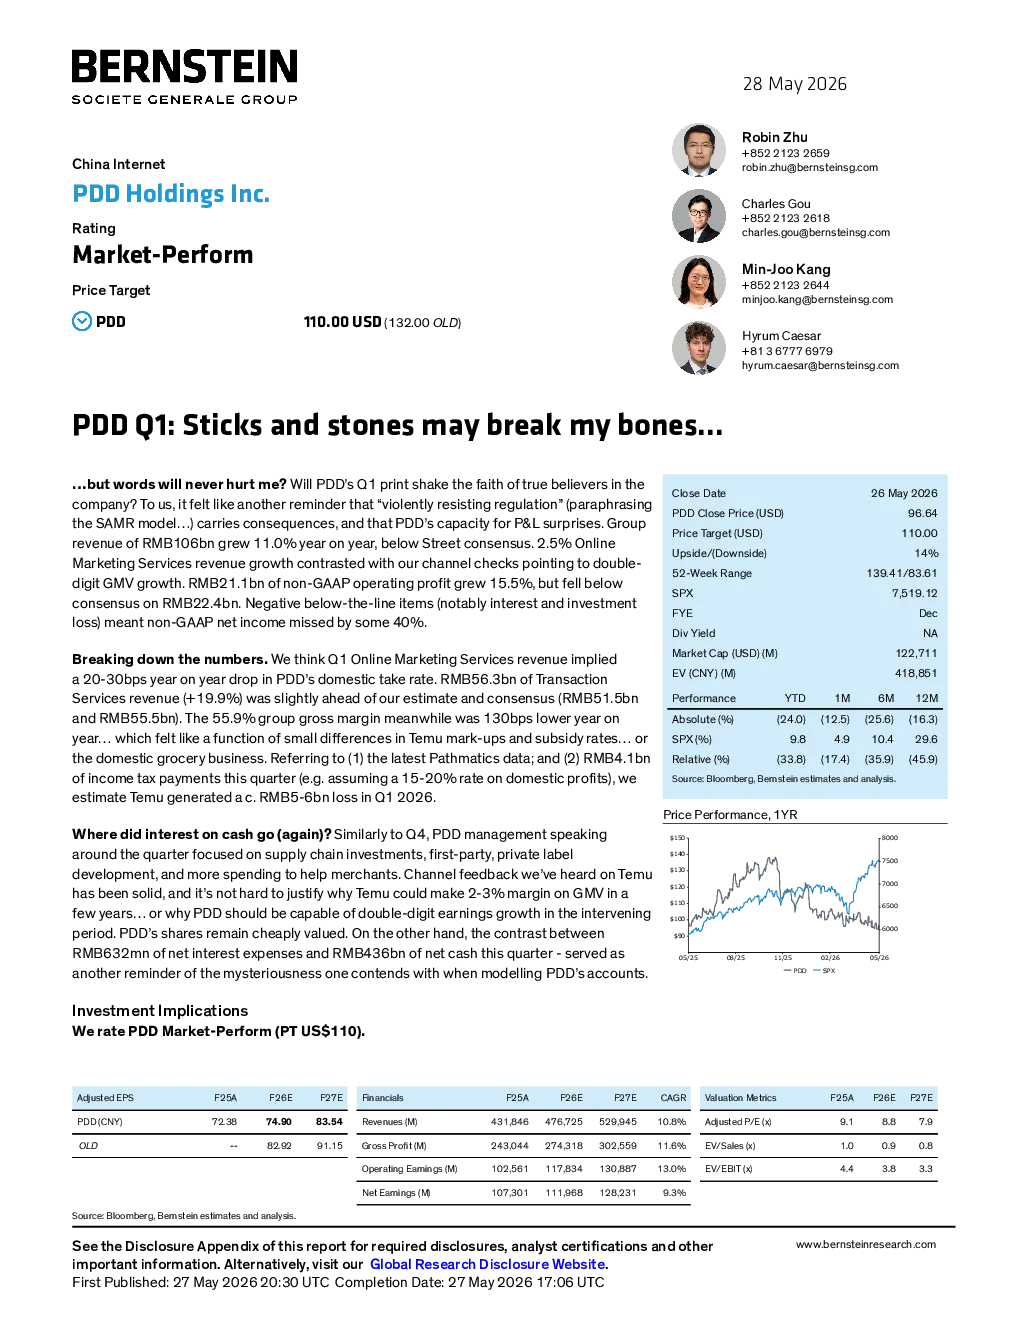
Robin Zhu+852 2123 2659robin.zhu@bernsteinsg.com China Internet PDD Holdings Inc. Charles Gou+852 2123 2618charles.gou@bernsteinsg.com Rating Market-Perform Min-Joo Kang+852 2123 2644minjoo.kang@bernsteinsg.com Price Target PDD 110.00 USD(132.00OLD) Hyrum Caesar+81 3 6777 6979hyrum.caesar@bernsteinsg.com PDD Q1: Sticks and stones may break my bones... …but words will never hurt me?Will PDD’s Q1 print shake the faith of true believers in thecompany? To us, it felt like another reminder that “violently resisting regulation” (paraphrasingthe SAMR model…) carries consequences, and that PDD’s capacity for P&L surprises. Grouprevenue of RMB106bn grew 11.0% year on year, below Street consensus. 2.5% OnlineMarketing Services revenue growth contrasted with our channel checks pointing to double-digit GMV growth. RMB21.1bn of non-GAAP operating profit grew 15.5%, but fell below Close Date26 May 2026PDD Close Price (USD)96.64Price Target (USD)110.00Upside/(Downside)14%52-Week Range139.41/83.61SPX7,519.12FYEDecDiv YieldNAMarket Cap (USD) (M)122,711EV (CNY) (M)418,851 Breaking down the numbers.We think Q1 Online Marketing Services revenue implieda 20-30bps year on year drop in PDD’s domestic take rate. RMB56.3bn of TransactionServices revenue (+19.9%) was slightly ahead of our estimate and consensus (RMB51.5bnand RMB55.5bn). The 55.9% group gross margin meanwhile was 130bps lower year onyear… which felt like a function of small differences in Temu mark-ups and subsidy rates… orthe domestic grocery business. Referring to (1) the latest Pathmatics data; and (2) RMB4.1bn Where did interest on cash go (again)?Similarly to Q4, PDD management speakingaround the quarter focused on supply chain investments, first-party, private labeldevelopment, and more spending to help merchants. Channel feedback we’ve heard on Temuhas been solid, and it’s not hard to justify why Temu could make 2-3% margin on GMV in afew years… or why PDD should be capable of double-digit earnings growth in the intervening Investment Implications We rate PDD Market-Perform (PT US$110). DETAILS A SQUISHY QUARTER… INTEREST INCOME BACK IN FOCUS PDD’s Q1 print was mediocre. Q1 revenue (RMB106bn, +11.0% year on year) split our estimates (RMB105bn) and streetconsensus (RMB109bn). RMB21.1bn of non-GAAP operating profit (+15.5% year on year) meanwhile was 6.0% below whatthe street had modeled (RMB22.4bn). We think 2.5% OMS revenue growth this quarter (to RMB49.9bn) implied a 20-30bps year on year drop in ad monetisationrates. Transaction Services revenue (RMB56.3bn) grew 19.9% year on year this quarter, the beat versus us and consensus(RMB51.5bn and RMB55.5bn) likely reflecting small differences in Temu revenue recognition (e.g. net of mark-ups on merchant RMB33.8bn of group-level marketing spend was 7% higher than we’d modeled (RMB31.5bn). Modelling a modest sequentialdecline in Temu marketing spend from Q4 (Pathmatics data pointed to Q1 spend which was c. 33% lower year on year, andc. 13% lower versus Q4), we think it’s likely Temu as a whole saw losses in the RMB5-6bn range. RMB4.4bn of R&D spendtranslated into a spend ratio of 4.2% of revenue, 20bps higher sequentially and 50 bps higher versus the prior year quarter. All Our updated price target for PDD falls to US$110, on lower EPS estimates multiplied by a 9x FY+1 PE multiple, lowered(previously 10x) to reflect the company’s ongoing ability to surprise in what ought to be innocuous parts of the P&L. Exhibit 2 shows a summary of our estimate changes for the company. Q1 REPORTING IN CHARTS Exhibit 3 to Exhibit 8 show the key data points we track for the company on a quarterly basis. EXHIBIT 6:We think PDD’s domestic all-in take rate wasc. 5.1% in Q1 2026, flattish versus a year ago APPENDIX - FINANCIAL FORECASTS BERNSTEIN TICKER TABLE DISCLOSURE APPENDIX I. REQUIRED DISCLOSURES References to "Bernstein" or the “Firm” in these disclosures relate to the following entities: Bernstein Institutional Services LLC(April 1, 2024 onwards), Sanford C. Bernstein & Co., LLC (pre April 1, 2024), Bernstein Autonomous LLP, BSG France S.A. (April 1,2024 onwards), Sanford C. Bernstein (Hong Kong) Limited盛博香港有限公司,Sanford C. Bernstein (Canada) Limited, SanfordC. Bernstein (India) Private Limited (SEBI registration no. INH000006378), Sanford C. Bernstein (Singapore) Private Limited,Sanford C. Bernstein Japan KK(サンフォード・C・バーンスタイン株式会社)and analysts employed by Société GénéraleAfrica Technologies & Services to produce Bernstein research under a Global Services Agreement in place between Bernstein Bernstein is part of a joint venture between Société Générale (SG) and AllianceBernstein, L.P. (AB). Unless specifically notedotherwise, for purposes of these disclosures, references to Bernstein’s “affiliates” relate to both SG and AB and their respectiveaffiliates. VALUATION METHODOLOGY PDD Holdings Inc. We value PDD at US$110 per share, on a 9x FY+1 (i.e. quarter 5-8) PE multiple. RISKS PDD Holdings Inc.