您的浏览器禁用了JavaScript(一种计算机语言,用以实现您与网页的交互),请解除该禁用,或者联系我们。 [摩根士丹利三菱日联证券]:将大型语言模型应用于企业分析和股票投资策略 - 发现报告

将大型语言模型应用于企业分析和股票投资策略

报告封面

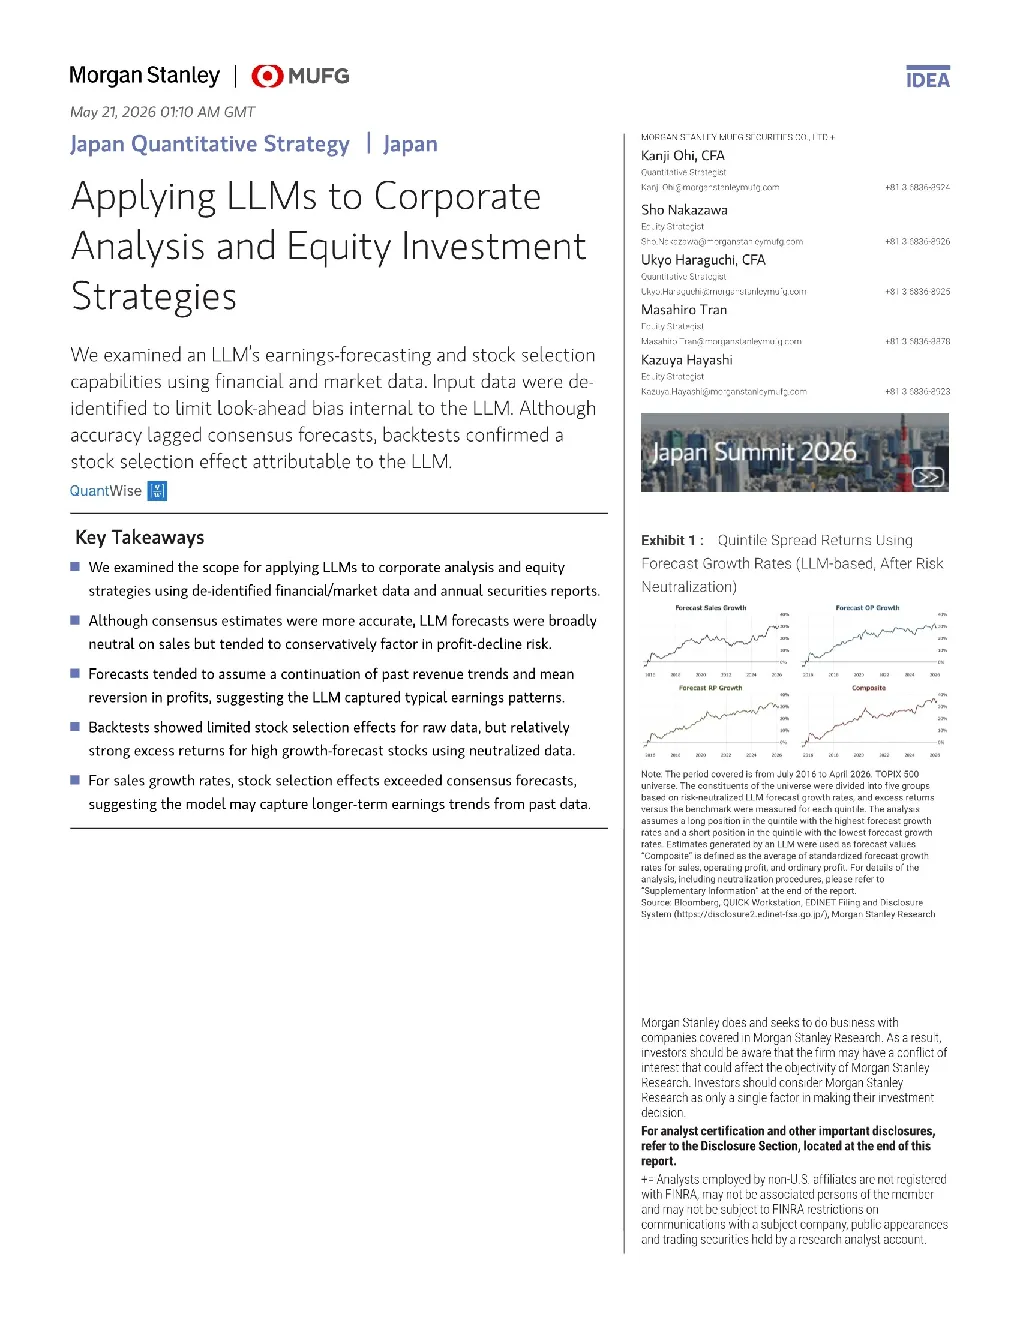
Japan Quantitative Strategy I Japan Kanji Ohi, CFAQuantitative Strategist Kanj.Ohi@morganstanleymufg.comSho Nakazawa Applying LLMs to CorporateAnalysis and Equity InvestmentStrategies Equity StrategistSho.Nakazawa@morganstanleymufg.comUkyo Haraguchi, CFAQuantitative Strateqist Ukyo.Haraguchi@mcnorganstanleymufg.comMasahiro TranEquity Strategist Masahiro.Tran@ganstanleymufg.comKazuya Hayashi capabilities using financial and market data. Input data were de-identified to limit look-ahead bias internal to the LLM. Althoughaccuracy lagged consensus forecasts, backtests confirmed astock selectioneffect attributabletothe LLM.QuantWise[] Equity StrategistKazuya.Hayashi@nanstanleymufg.com Key TakeawaysWe examined the scopefor applying LLMs to corporate analysis and equity strategies using de-identified financial/market data and annual securities reports.Althoughconsensus estimates were more accurate, LLMforecasts were broadlyneutral on sales but tended to conservatively factor in profit-decline risk.Forecasts tended to assume a continuation of past revenue trends and meanreversion in profits, suggesting the LLM captured typical earnings patterns.Backtests showed limited stock selection effects for raw data, but relativelystrong excess returns for high growth-forecast stocks using neutralized data.For sales growth rates, stock selection effects exceeded consensus forecasts,suggesting the model may capture longer-term earnings trends from past data. universe. The constituents of the universe were divided into five groupsalized LLM forecast growth rates, and excess returnsversus the benchmark were measured for each quintile. The analysisssumes a long position in the quintile with the highest forecast growthnerated by an LLM were used as forecast valuesrates for sales, operating profit, and ordinary profit. For details of theanalysis, including neutralization procedures, please refer to'Supplernentary Information" at the end of the reportSource: Bloomberg, QUICK Workstation, EDINET Filing and DisclosureSystem (https:/disclosure2.edinet-fsa.go.jp/), Morgan Stanley Research Morgan Stanley does and seeks to do business withcompanies covered in Morgan Stanley Research. As a resultinvestors should be aware that the firm may have a conflict ofinterest that could affect the objectivity of Morgan StanleyResearch. Investors should consider Morgan StanleyResearch as only a single factor in making their investmentdecision. For analyst certification and other important disclosures,refer to the Disclosure Section, located at the end of thisreport. += Analysts employed by non-U.S. affliates are not registeredwith FINRA, may not be associated persons of the memberand may not be subject to FINRA restrictions oncommunications with a subject company,public appearancesand trading securities held by a research analyst account. Summary of analysis corporate analysis and equity investment strategy. Since LLMs are trained using data up tothe knowledge cut-off point, there is a possibility of look-ahead bias when backtestingusing historical data. In our analysis, we seek to minimize this risk by expressing the timingof share price/financial and economic indicators as a point relative to the analysis date, de-identifying MD&A (management discussion and analysis) text in annual securities reportsby removing data such as company names,reporting dates, and customer names, andstipulating in the prompt that only input data is to be used. The analysis universe is theTOPIX 1000 component names, and the investigation period is June 2016 through April2026, with only actual data that are available as at end-June in each year being used. Wethen use GPT-5.5 to forecast next-FY revenue, OP, and RP. We exclude guidance andanalyst forecasts from our input data and assess the LLM's capacity for predictingearnings from historical information. results for March year-end companies, and compared these with the consensus forecasts.Our analysis found that the consensus forecasts showed greater predictive accuracy thanthe LLM forecasts for all items: revenue, OP, and RP. For profit lines in particular, the LLMaccurately predicted growth for a relatively low proportion of names that actuallyreported profit growth (low recall), indicating a tendency towards conservative profitgrowth forecasts. Meanwhile, although the LLM showed a high recall for profit declineforecasts, the precision rate was low, pointing to a tendency to generate broad profitdecline signals. Among LLM-generated estimates,revenue forecasts have a positive correlation with pastrevenue growth and RP growth rates, suggesting they reflect an assumption that pasttrends would continue. Meanwhile, OP and RP forecasts show a negative correlation withpast RP growth rates, possibly indicating that the estimates assume mean reversion. Thatsaid, considering the low precision rate for profit decline forecasts, we would hesitate toconclude that the mean reversion perspective necessarily implies ac