资金流向观察:地缘政治搅动
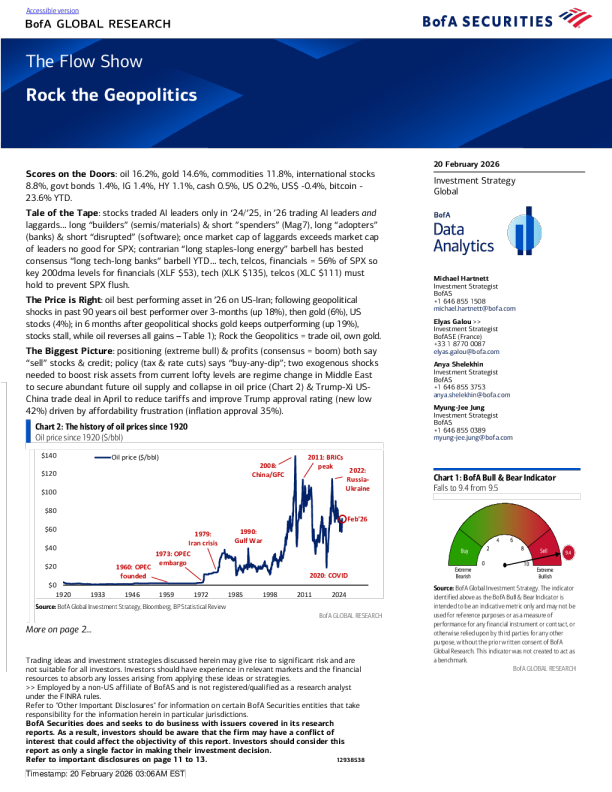
Rock the Geopolitics 20 February 2026 Scores on the Doors: oil 16.2%, gold 14.6%, commodities 11.8%, international stocks8.8%, govt bonds 1.4%, IG 1.4%, HY 1.1%, cash 0.5%, US 0.2%, US$ -0.4%, bitcoin -23.6% YTD. Investment StrategyGlobal Tale of the Tape: stocks traded AI leaders only in‘24/’25, in’26 trading AI leadersandlaggards…long“builders”(semis/materials) & short”spenders”(Mag7), long“adopters”(banks) & short“disrupted”(software); once market cap of laggards exceeds market capof leaders no good for SPX; contrarian“long staples-long energy”barbell has bestedconsensus“long tech-long banks”barbell YTD…tech, telcos, financials = 56% of SPX sokey 200dma levels for financials (XLF $53), tech (XLK $135), telcos (XLC $111) must MichaelHartnettInvestment StrategistBofAS+1 646 855 1508michael.hartnett@bofa.com The Price is Right: oil best performing asset in’26 on US-Iran; following geopoliticalshocks in past 90 years oil best performer over 3-months (up 18%), then gold (6%), USstocks (4%); in 6 months after geopolitical shocks gold keeps outperforming (up 19%),stocks stall, while oil reverses all gains–Table 1); Rock the Geopolitics = trade oil, own gold. Elyas Galou>>Investment StrategistBofASE (France)+33 1 8770 0087 The Biggest Picture: positioning (extreme bull) & profits (consensus = boom) both say“sell”stocks & credit; policy (tax & rate cuts) says“buy-any-dip”; two exogenous shocksneeded to boost risk assets from current lofty levels are regime change in Middle Eastto secure abundant future oil supply and collapse in oil price (Chart 2) & Trump-Xi US-China trade deal in April to reduce tariffs and improve Trump approval rating (new low Anya ShelekhinInvestment StrategistBofAS+1 646 855 3753anya.shelekhin@bofa.com Myung-Jee JungInvestment StrategistBofAS+1 646 855 0389myung-jee.jung@bofa.com Source:BofA Global Investment Strategy. The indicatoridentified above as the BofA Bull & Bear Indicator isintended to be an indicative metric only and may not beused for reference purposes or as a measure ofperformance for any financial instrument or contract, orotherwise relied upon by third parties for any other More on page 2… Trading ideas and investment strategies discussed herein may giverise to significant risk and arenot suitable for all investors. Investors should have experience in relevant markets and the financialresources to absorb any losses arising from applying these ideas or strategies. >> Employed by a non-US affiliate of BofAS and is not registered/qualified as a research analystunder the FINRA rules. Refer to "Other Important Disclosures" for information on certain BofA Securities entities that takeresponsibility for the information herein in particular jurisdictions. BofASecurities does and seeks to do business with issuers covered in its researchreports. As a result, investors should be aware that the firm may have a conflict ofinterest that could affect the objectivity of this report. Investors should consider thisreport as only a single factor in making their investment decision. Weekly Flows: $35.2bn to stocks, $26.4bn to bonds, $23.8bn to cash, $1.4 from gold(largest outflow in 4 months), $0.8bn from crypto. Flows to Know: •TIPS: largest 3-week inflow since Mar’22 ($2.2bn);•International equities: record 4-week inflow ($64.6bn–Chart 6); •Korea equities: largest 6-week inflow ever ($17.7bn); •Financials: largest 2-week outflow in 9 weeks ($0.8bn). Big Flow to Know: in 2026, for every $100 of inflows to global equity funds, US stockshave accounted for $26, their lowest share since 2020 (Chart 5); the US share peaked in2022 at $92, was $73 in 2024 and fell to $45 in 2025; US exceptionalism theme endingwith lower relative inflows to US assets, not outflows from US assets. BofA Private Clients: $4.3tn AUM…,64.3% stocks, 18.0% bonds, 10.5% cash; biggestequity ETF inflow in 8 weeks; inflow to T-notes (2-10 years) vs outflows from T-bills (<1year) and T-bonds (20-30 years); in ETFs past 4 weeks, private clients buying Japan, EMdebt, municipals and selling bank loan, utilities, and REITs. BofA Bull & Bear Indicator: falls from 9.5 to 9.4; Bull & Bear Indicator reads“extremebull”, near highest since Jan'18 on sustained inflows to global stock ETFs & tech funds,strong global stock index breadth (75% of ACWI markets trading >50 & 200dma), bullishBofA Global FMS positioning (e.g., cash levels 3.4%) partially offset by outflows from EMdebt, hedge funds turning net long VIX futures; Bull & Bear Indicator moved to >9.5 onFeb 3rd…only 3 times past 25 years (Jan'04, Mar'06, Jan'18)…median“max drawdown”in following 3 months was ACWI -4.3%, S&P500 -5.5%, Nasdaq -8.6% (Table 2);“old”BofA Bull & Bear Indicator at 6.1 (Chart 3)…note the historic data shows very close comparison between old & new series…recent divergence reflects greed in new datainputs on flows, hedge funds, credit technicals, specifically inflows to global stock ETFs, Source:BofA Global Investment Strategy, Bloomberg


